Photos courtesy of: Veolia North America and Clean Harbors
The Solvent Recycling Report by EI Digest Quarterly provides a meticulous evaluation of the commercial hazardous waste solvent recycling sector in the United States. This insightful report offers a comprehensive analysis of the industry’s performance, comparing data from previous years to ensure accuracy and rectify misreported information. By uncovering intriguing insights and identifying key trends in the solvent recycling landscape, this report serves as an invaluable resource for market analysts, strategists, regulatory experts, and investment professionals. The meticulous figures and tables presented by EI Digest highlight the fluctuations observed in reported solvent recycling receipts, shedding light on the nuances of the market. With its comprehensive analysis, expert commentary, and authoritative insights from over 30 years of coverage in hazardous waste management, the Solvent Recycling Report by EI Digest Quarterly empowers professionals to make well-informed decisions. It stands as a reliable and independent third-party examination of the RCRA hazardous waste solvent recycling landscape in the United States, making it an indispensable resource for any industry professional seeking accurate and trustworthy information.
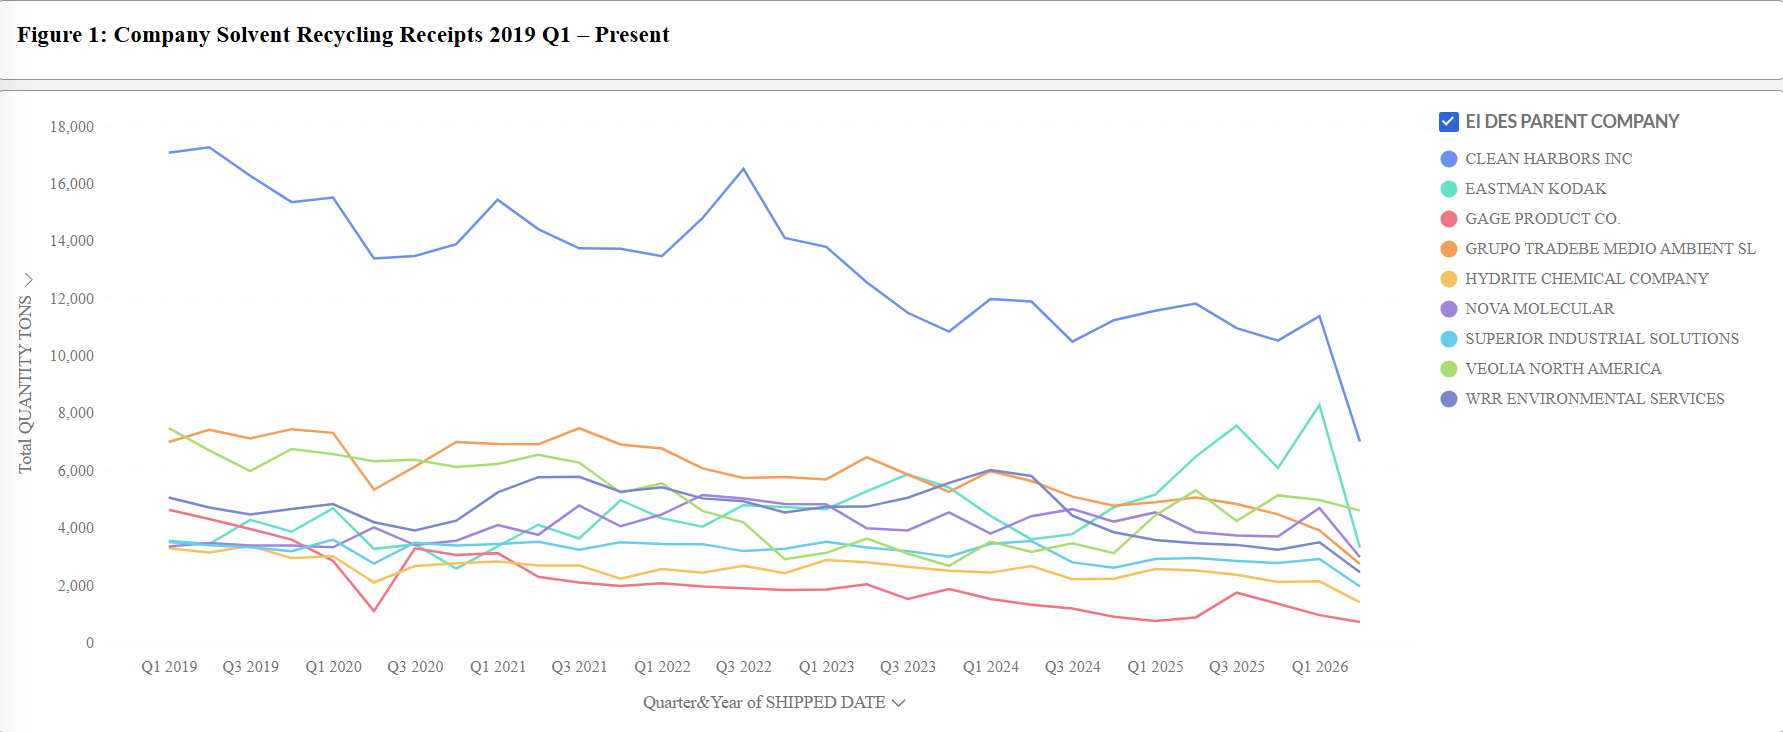
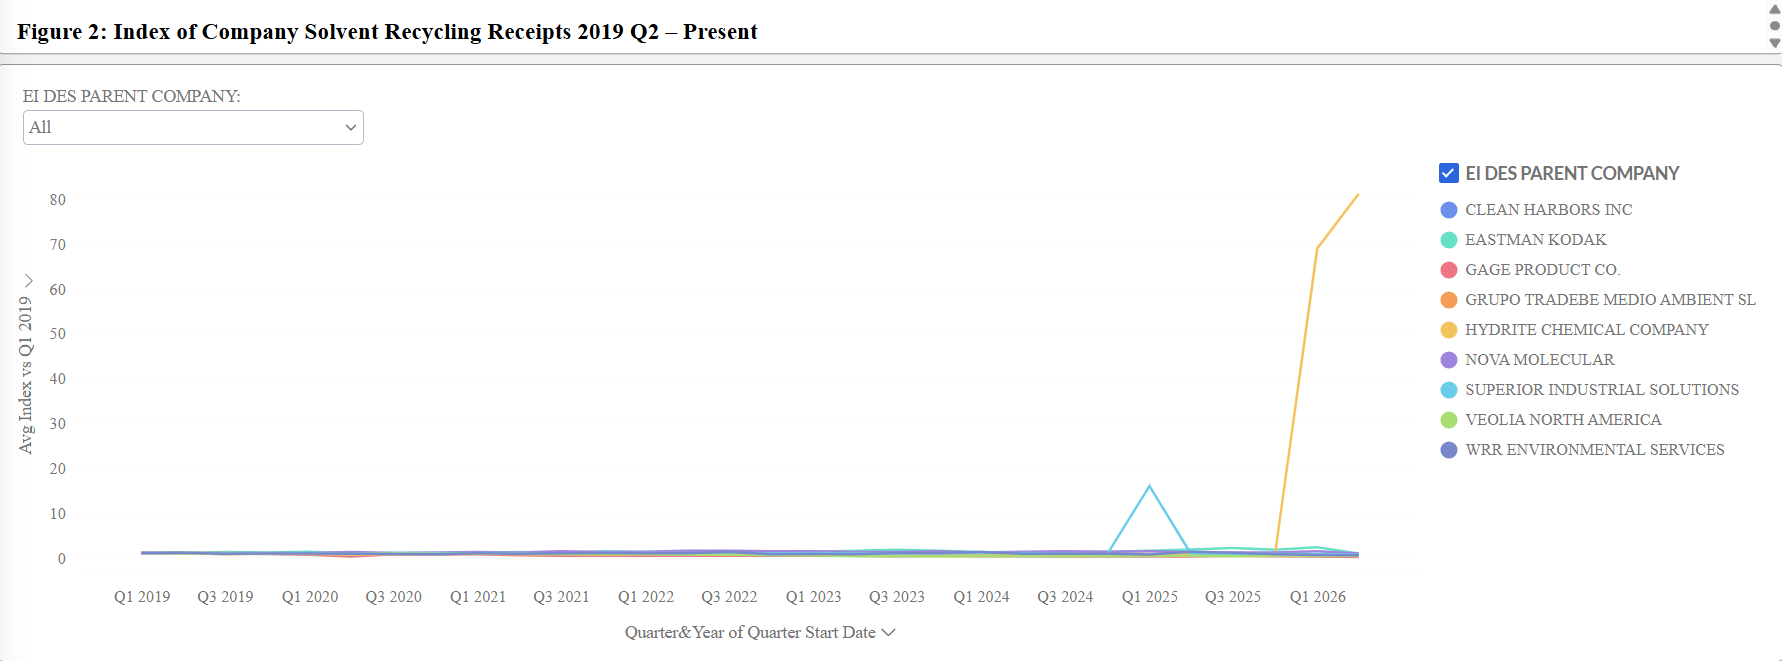
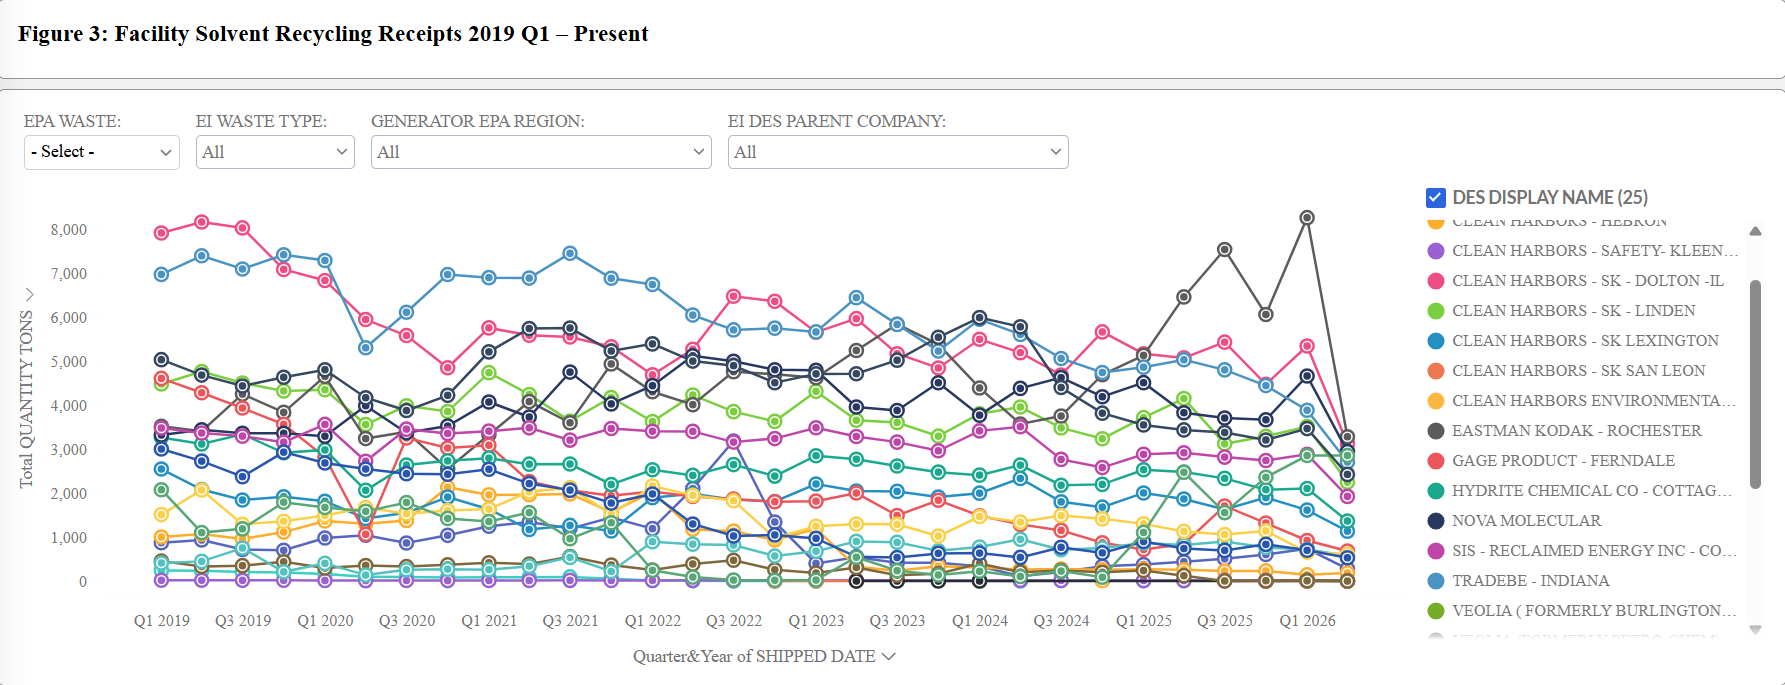
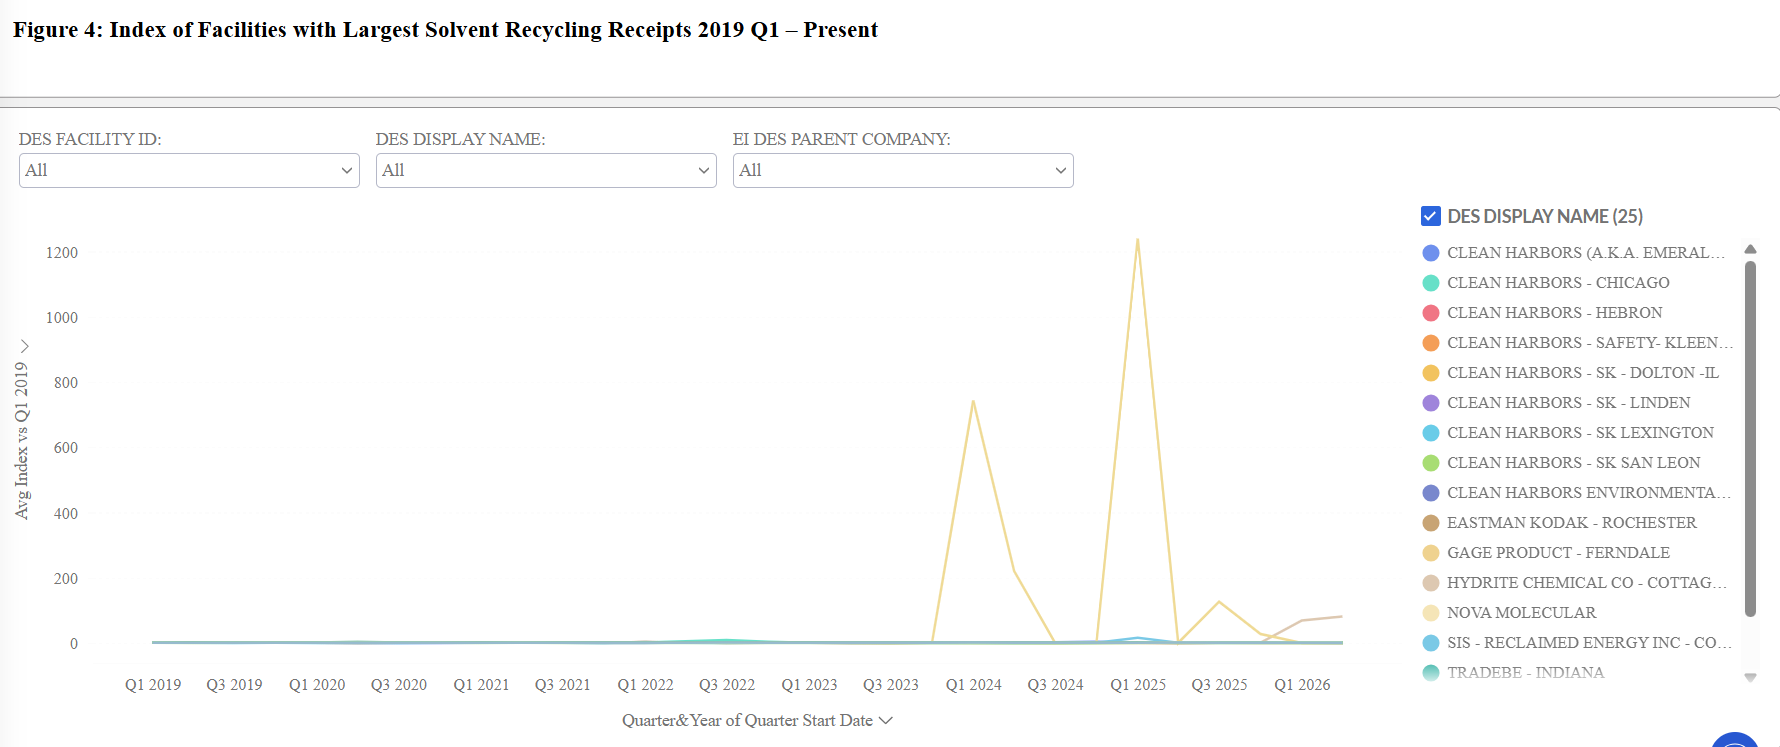
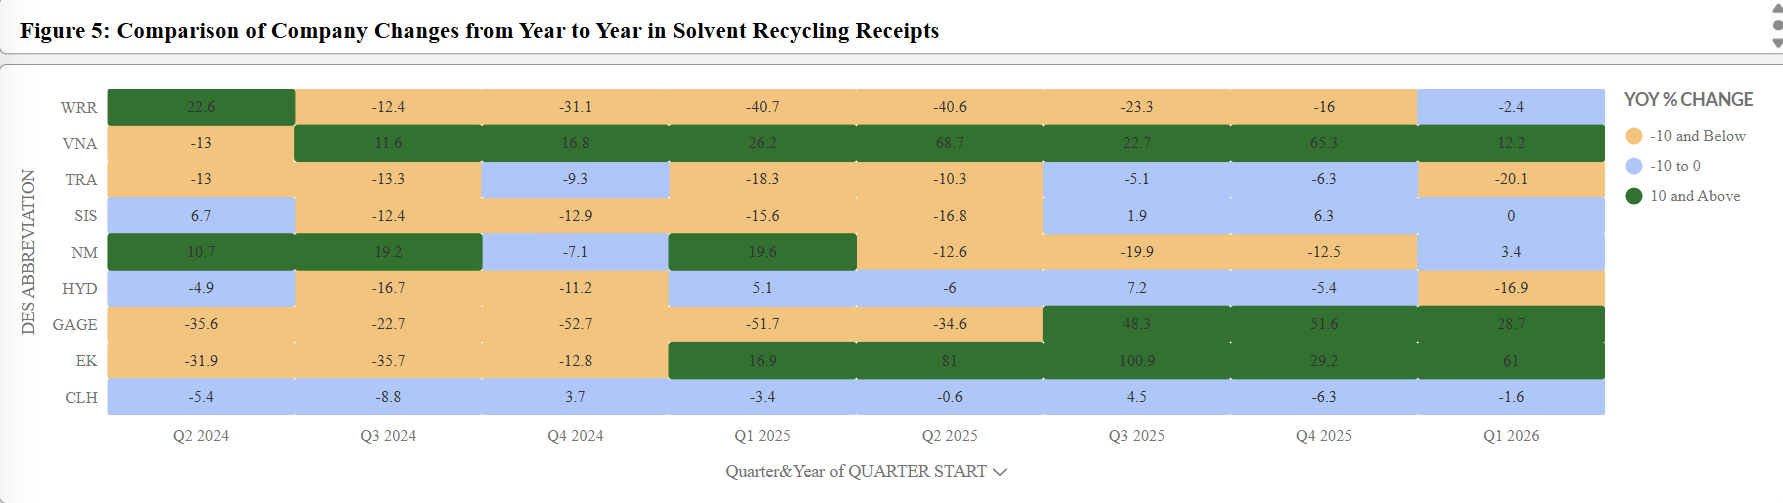
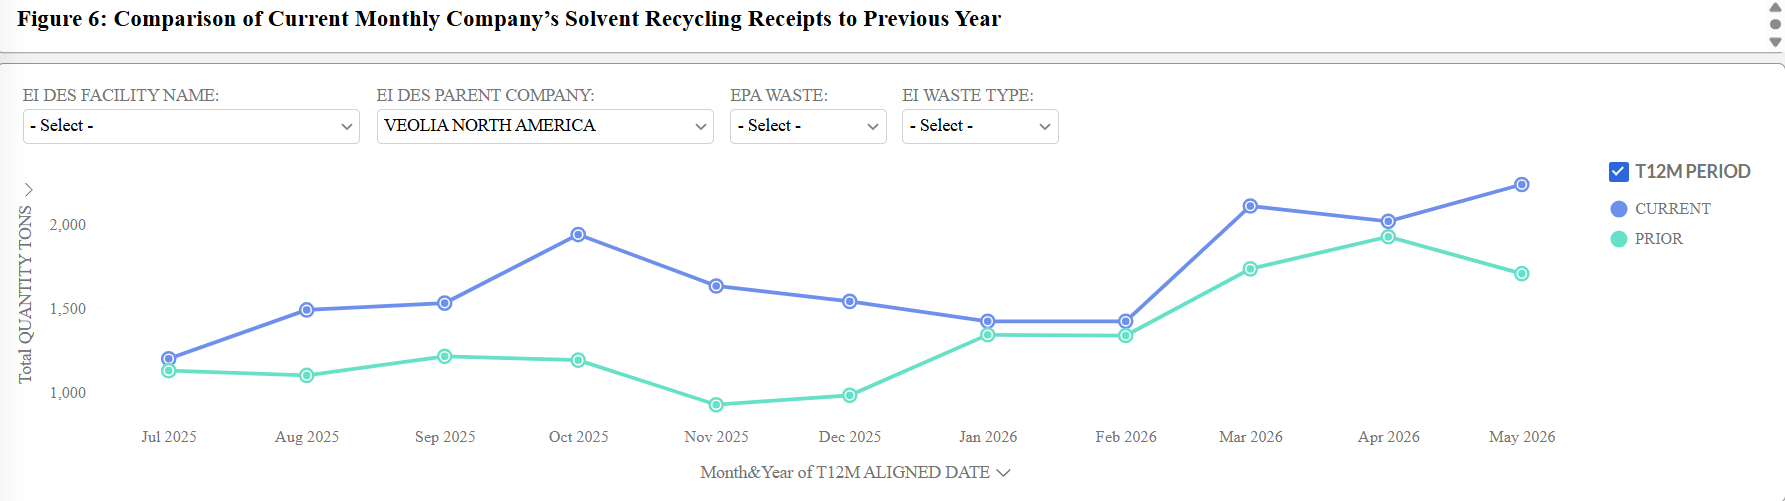
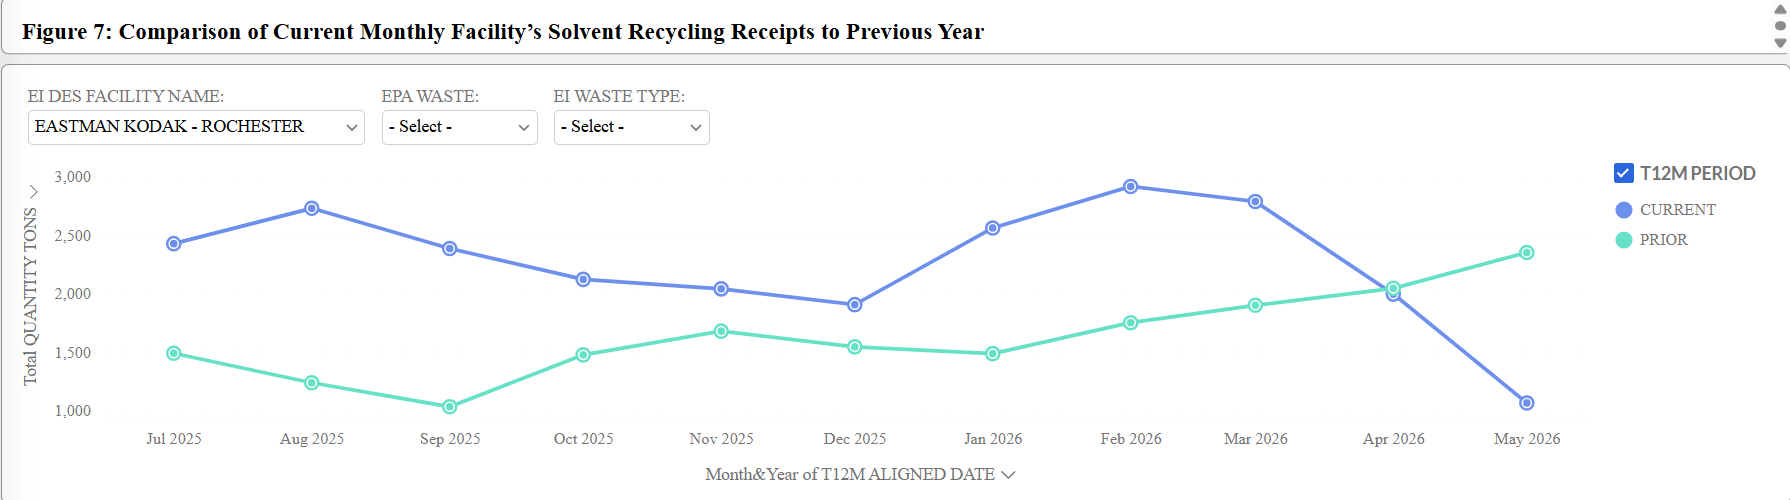
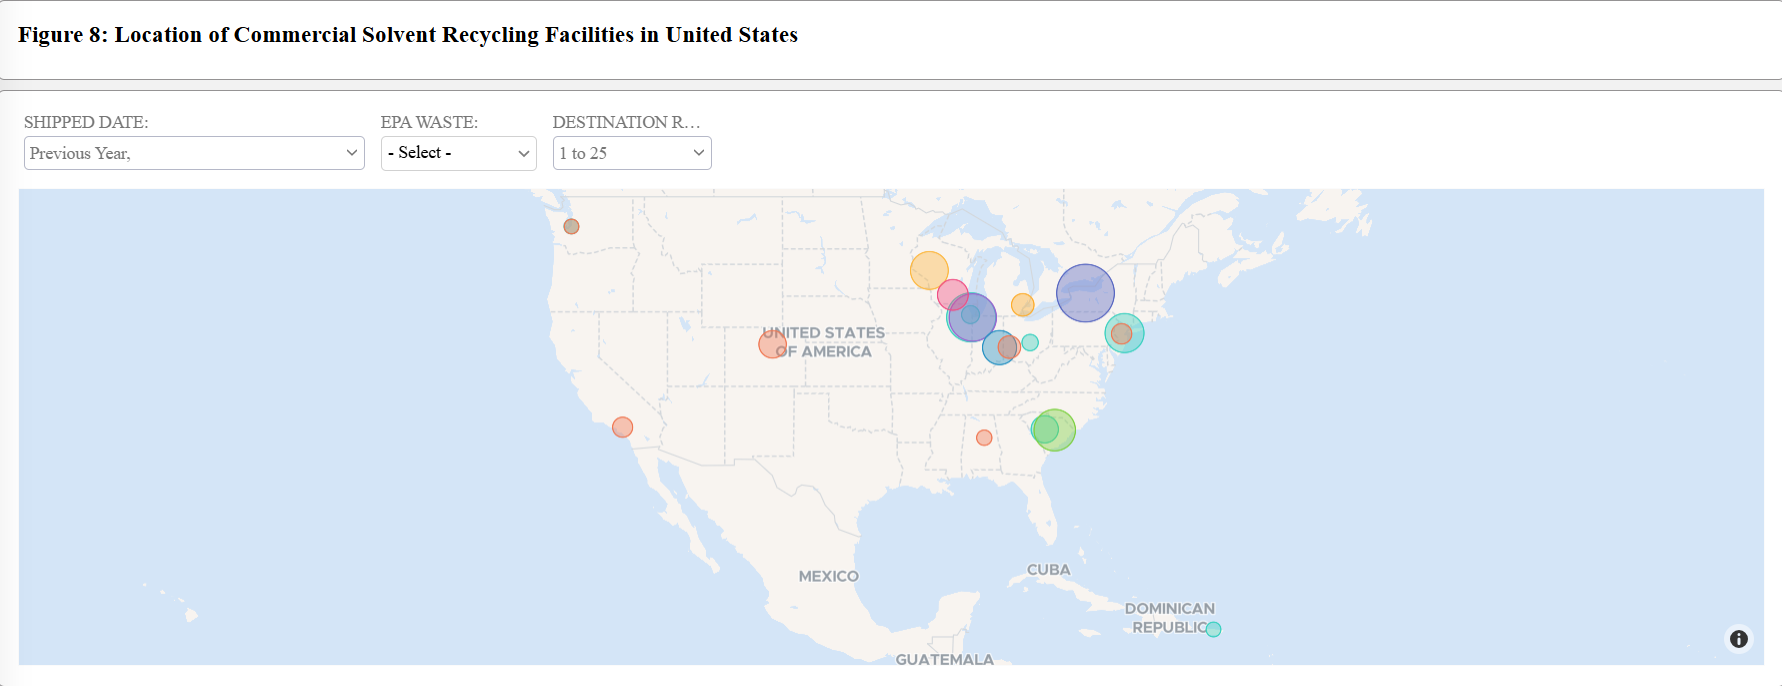
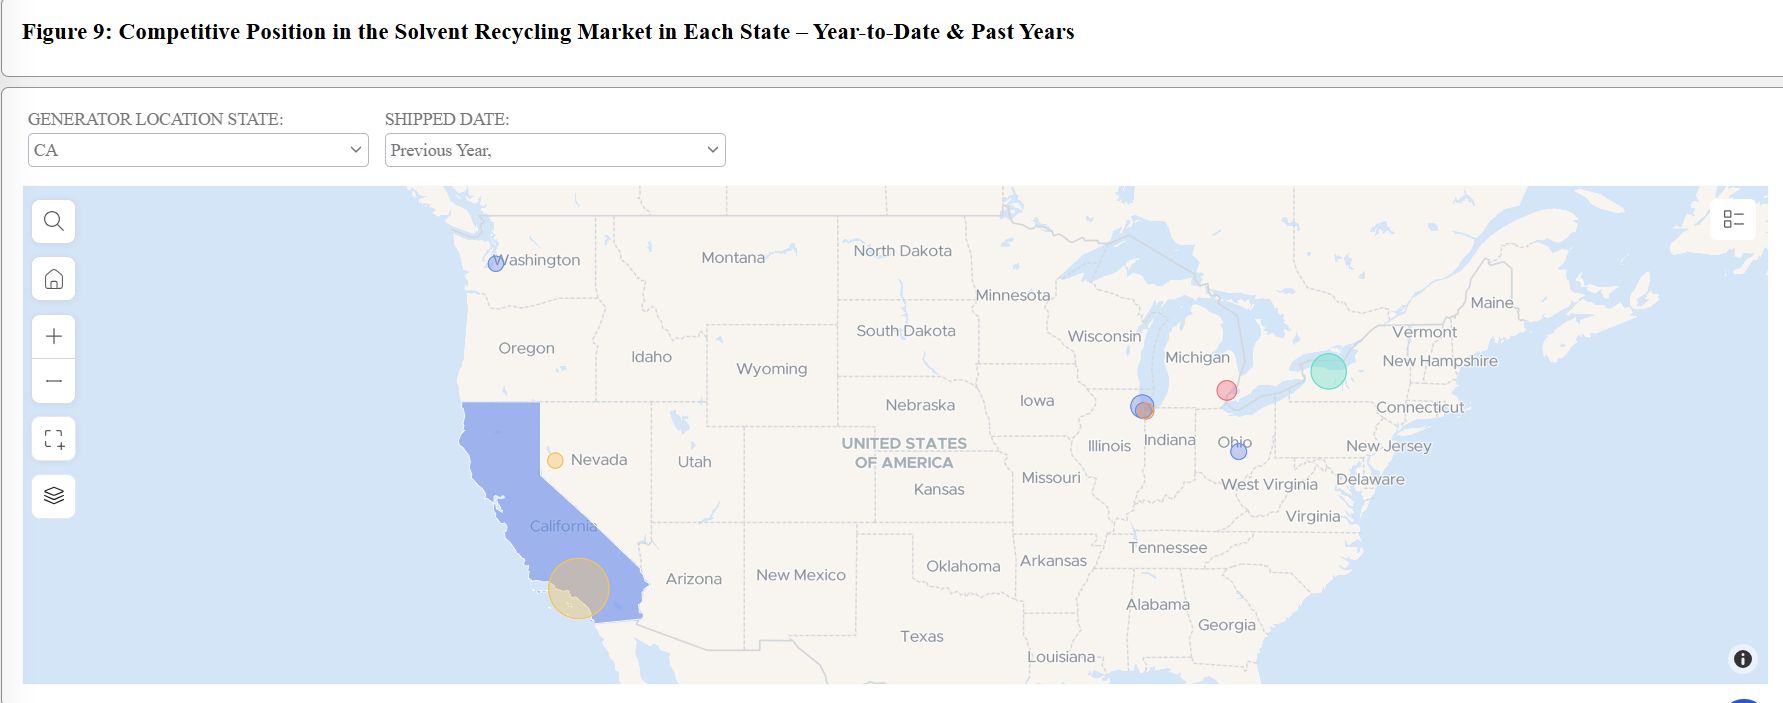
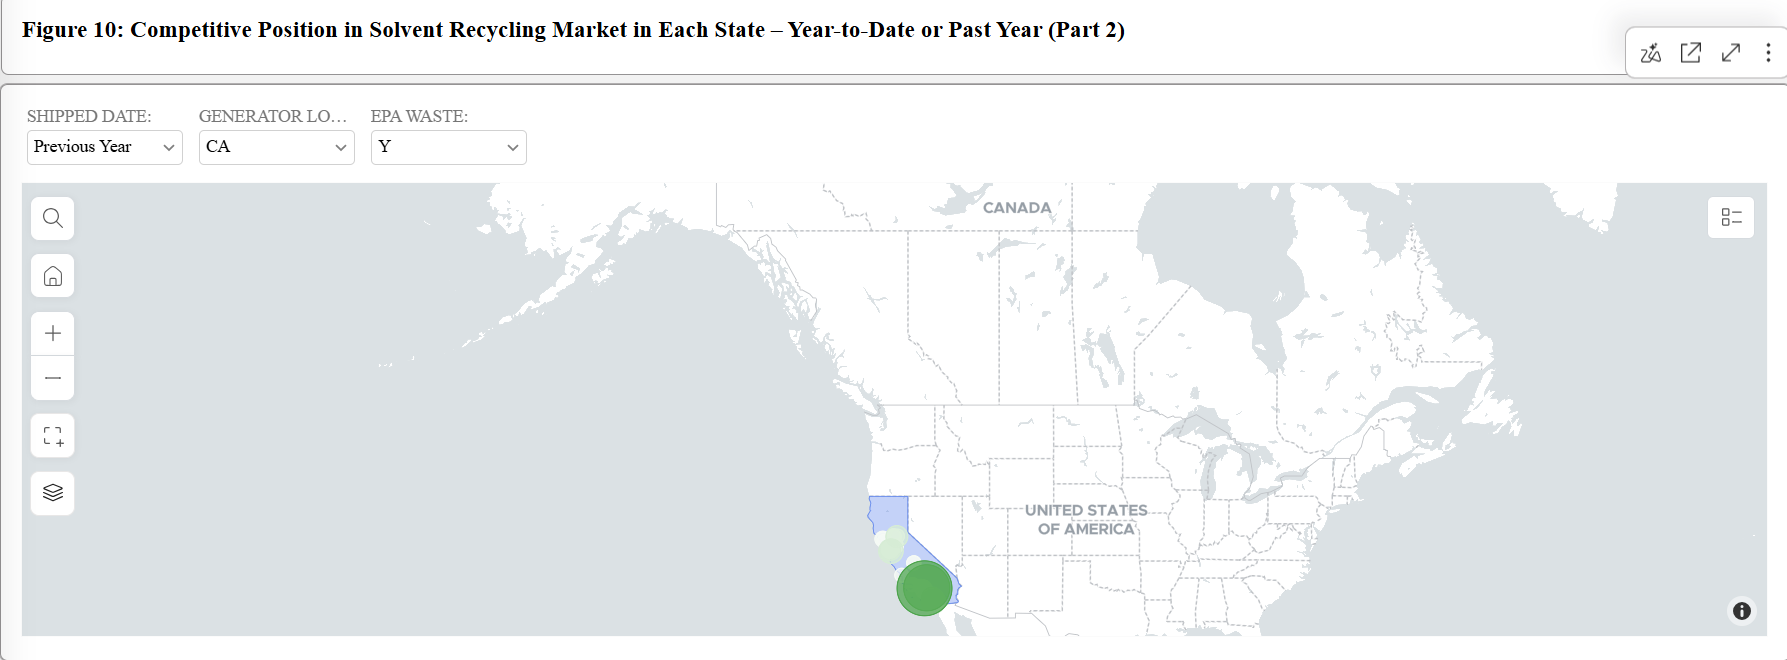
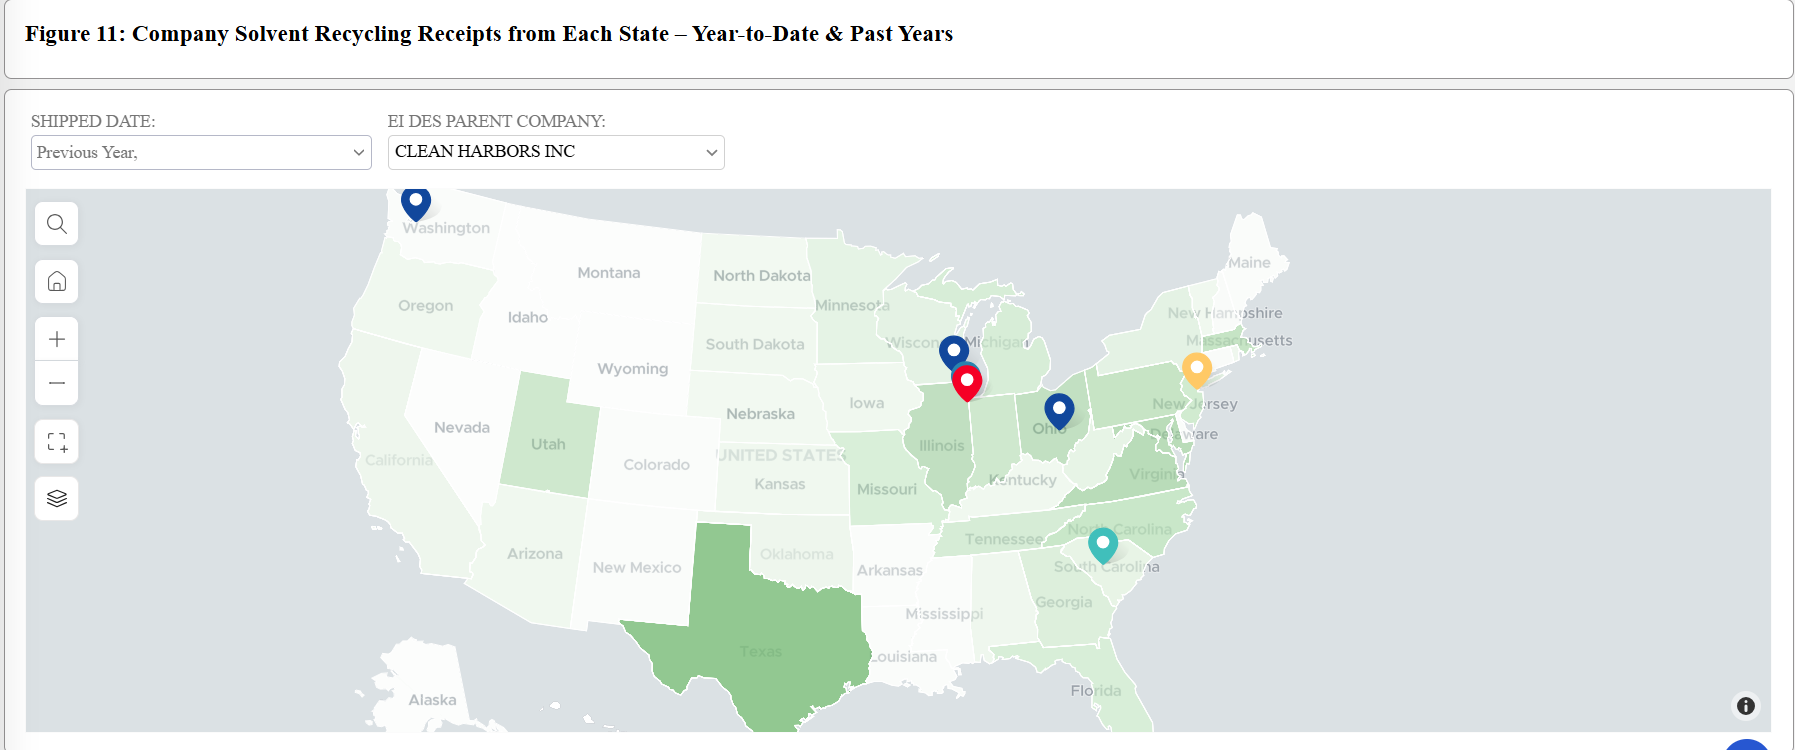
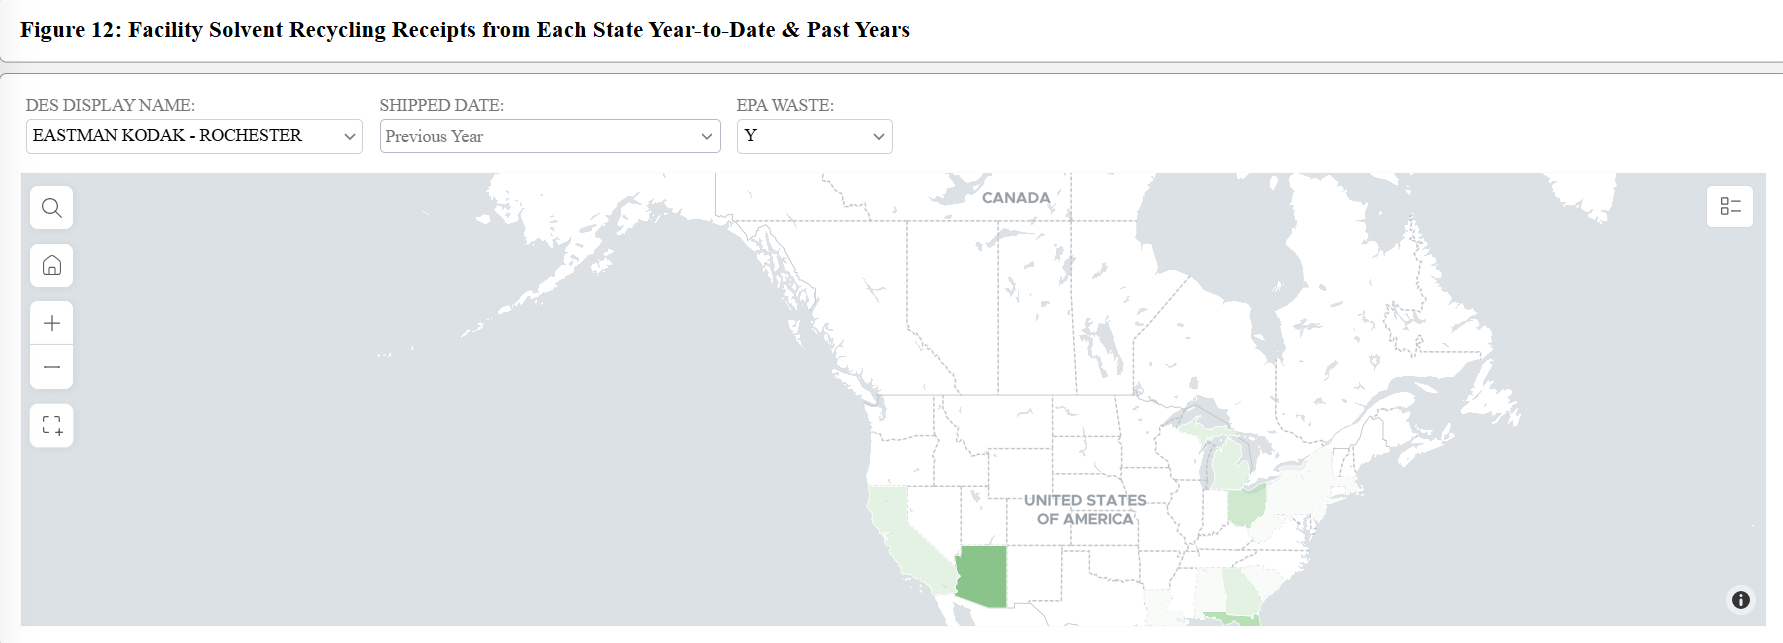
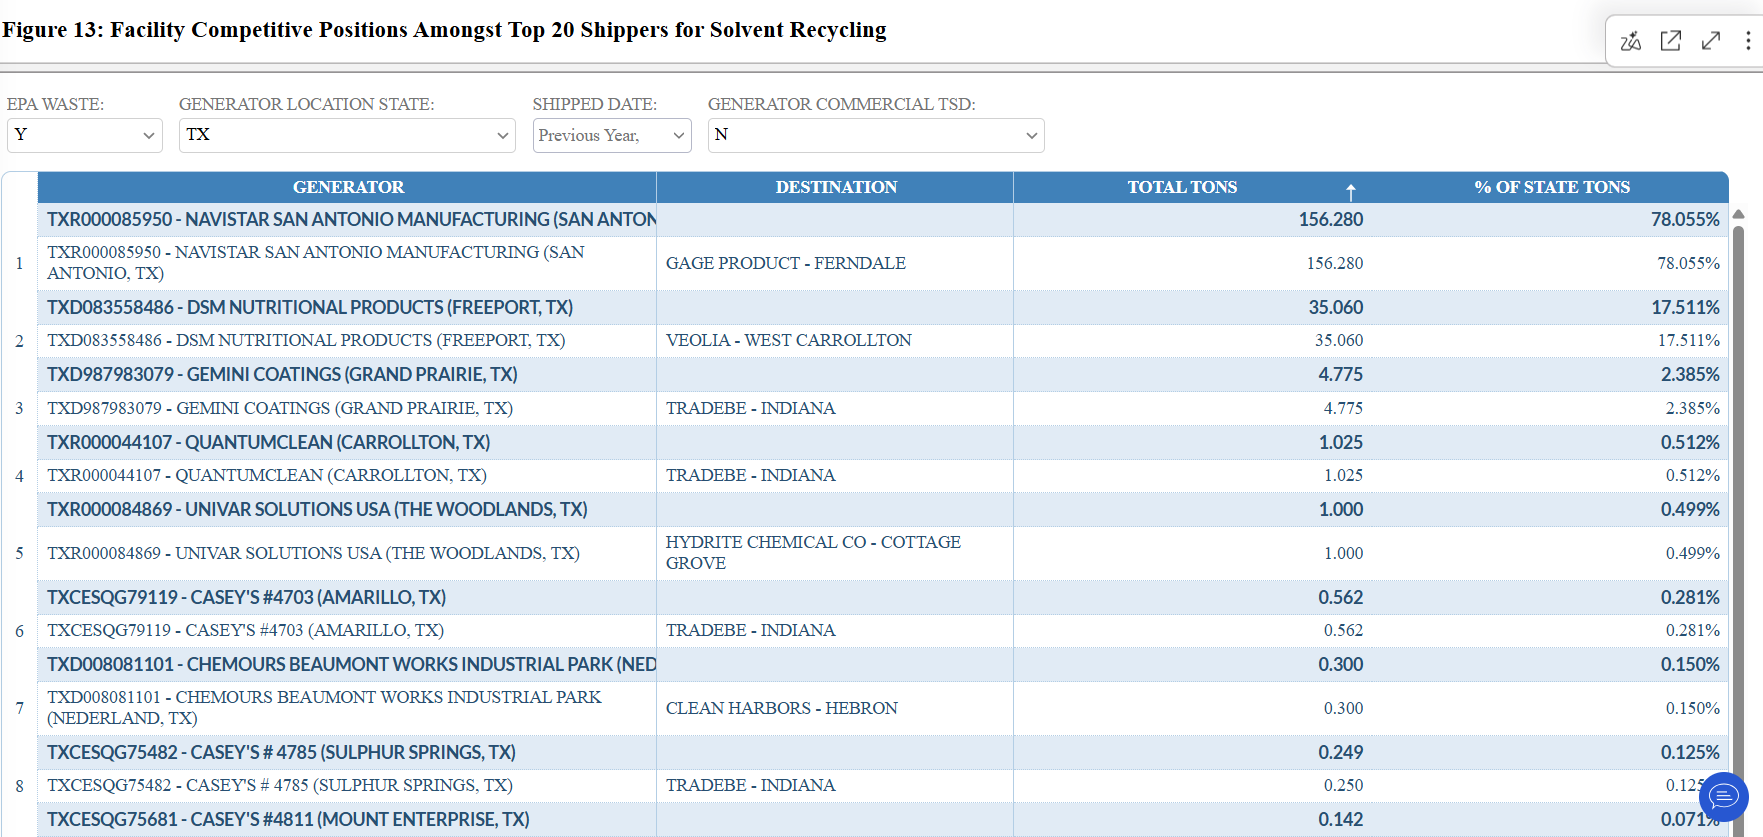
Figure 1: Individual company receipts of hazardous waste for solvent recycling (H020) are represented. All the reported solvent recycling receipts of Clean Earth Inc (“CEI”) since 2019 have been included with the solvent recycling receipts of Veolia North America (“VNA”). The acquisition of CEI by VNA was finalized in July 2026.Figure 2: Provides the Envirobiz Solvent Recycling Index for all eleven companies. The Enviorbiz Solvent Recycling Index is based on the solvent recycling receipts in the most recent quarter compared to the solvent recycling receipts in first quarter 2019. All companies begin with an index of 1,0; increased receipts greater than 1, an index of below 1 is because of lower receipts.Figure 3: All receipts for solvent recycling at individual solvent recycling facilities from Q1 2019 through the most recent quarter. all of the major commercial solvent recovery facilities in the United States. A company (e.g. Eastman Kodak) that has only one facility is includeFigure 4: The same facilities as Figure 3 are included in Figure 4. The facility index is based on their receipts in 2019 Q1 with a value of 1.0. Increases in the receipts in subsequent quarters would result in an index above 1.0. Comparison of two or more facility indexes provides an indication of each facility’s proportional gains/losses since 2019.Figure 5: Quarterly solvent recycling receipts of each company is compared for year to year changes from 2023 through 2025. More specifically, Q1 2023 is compared to Q1 2022. Gains of greater that 10% are colored green, losses of more than 10% are in yellow, and light blue is small changes. The pattern of color, such as persistent green reflects consistent company growth in solvent recycling receiptsFigure 6: The company monthly totals in this chart represent a consolidation of all solvent recycling receipts at all the company’s facilities. The receipts include both hazardous and nonhazardous waste. There is a three-month lapse in the reporting of each months shipments.Figure 7: The individual facility current monthly receipts of waste for solvent recycling is compared to the previous year. The receipts at each facility can be both hazardous and/or nonhazardous waste. The chart provides an excellent basis for examining whether any unusual decreases or spikes in solvent recycling receipts occurred in recent months.Figure 8: The location of all commercial solvent recyclling facilities in the United States is presented on the Figure 6. There are three options. The solvent recycling facilities presented in Figures 3 & 4: the second option is all solvent recycling facilities, and third option is the smaller facilities included in category “all others.”Figure 9: The US Map displays the Solvent Recycling Market in each state – Year to Date or Past Years. The selected state will display the top ten competitors with tons of waste received in either YTD or selected previous year.Figure 10: Select state to identify the top 20 real shippers from the state. The app will provide the name of the shipper, the amount shipped for solvent recycling in the selected year, the company receiving the shipment, and percent of state shipments that it represents.Figure 11: The US map displays the selected company receipts from all US states for either YTD or past year. A selected state will display the company YTD and past year company receipts from the state. Figure 12: The US map displays the selected facilities receipts from all US states for either YTD or a past year. A facility can be selected for examination of year-to -date monthly receipts. The state selection will provide YTD and previous years shipment from the state to a specific facility.Figure 13: Based on shipments records, the app will identify the top current or past 20 real shippers for solvent recycling from a state. The app will subsequently identify the receivers for the shippers in the current year or past years.